We built the tool we needed and could not find
zymtrace was started in 2023 by engineers who spent years debugging GPU inference workloads with tools that could not cross the Python-to-CUDA boundary. The fundamental problem was not a lack of data, it was a lack of connected data. That is what we set out to fix.
Founded 2023, San Francisco
Israel had spent years watching GPU budgets climb with no clear way to attribute spend to a specific line of code. The tooling existed to profile Python and to profile CUDA, but nothing connected the two at runtime. You could see that your model was slow, but you could not see which Python call was responsible for the kernel that was slow.
He met Sofia at a compiler infrastructure conference in 2022. She had been working on LLVM backends and CUDA toolchain internals at a semiconductor tools company and had been thinking about the same gap from the other direction: kernel-level attribution without source-level instrumentation. They started building the first version together in early 2023.
Diarmuid joined later that year, bringing six years of reliability engineering from a GPU cloud provider. He built the eBPF collection layer and data pipeline that made continuous sampling practical at production sampling rates.
In late 2025, zymtrace was angel-backed to grow the engineering team and expand hardware support beyond NVIDIA to AMD and future accelerator architectures.
Sampling profilers miss the GPU kernels that cost the most
When you are paying for H100s, the billing unit is time. But traditional profiling tools show you CPU time and GPU time in separate views, with no connection between them. You know your attention layer is slow but you do not know which CUDA kernel it is launching or why that kernel is expensive.
zymtrace uses eBPF to correlate Python frames with GPU kernel execution at 99Hz, continuously. Not sampling bursts triggered by a manual profiling session. Not a single-run trace you have to replay. Always on, attached to your running inference process, building the call path from model code to kernel every second.
The result is a flamegraph that actually tells you what to fix: which layer, which kernel, which call path, and what it cost you in GPU time this week.
Built by infrastructure and systems engineers
We came from GPU systems work, eBPF tooling, and ML infrastructure. That background shapes everything from the agent architecture to the flamegraph UI.
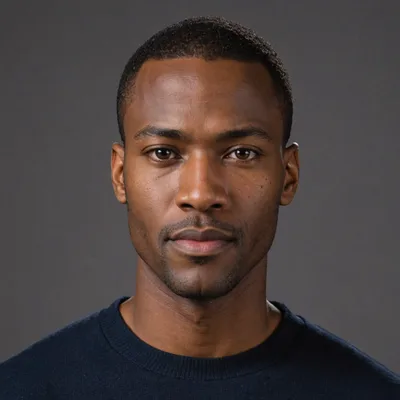
Israel Ogbole
Co-founder, CEO
Built distributed systems at scale before founding zymtrace. Spent years watching GPU budgets climb with no clear way to attribute spend to a specific line of code, which is why he started the company.

Sofia Moran
Co-founder, CTO
Previously worked on LLVM compiler backends and CUDA toolchain internals at a semiconductor tools company. Designed the kernel-level attribution engine at the core of zymtrace.

Diarmuid LaFevre
Lead Engineer
Spent six years in reliability engineering at a GPU cloud provider before joining zymtrace to build the eBPF collection layer and data pipeline.
Principles behind the tool
Continuous over on-demand
On-demand profiling sessions miss the rare event that causes production latency spikes. Continuous profiling at 99Hz sees everything, including the 2ms kernel that only appears under specific batch conditions.
No instrumentation required
Adding profiling decorators to production code creates maintenance burden and changes the behavior you are measuring. eBPF-based sampling is invisible to the workload and needs no code changes.
Attribution over averages
Knowing that your model uses 70% GPU utilization does not tell you where to optimize. Knowing that one specific call path accounts for 34% of total kernel time does.
We are hiring systems engineers
If you have worked on eBPF tooling, GPU driver internals, or ML infrastructure, we would like to talk. Remote-first, early team.